Quick Start
Navigation


Almost all screens of this application show a navigation bar with three icons at the bottom. They allow to quickly switch between the list of projects, the project view with a list of plots and the plot view.

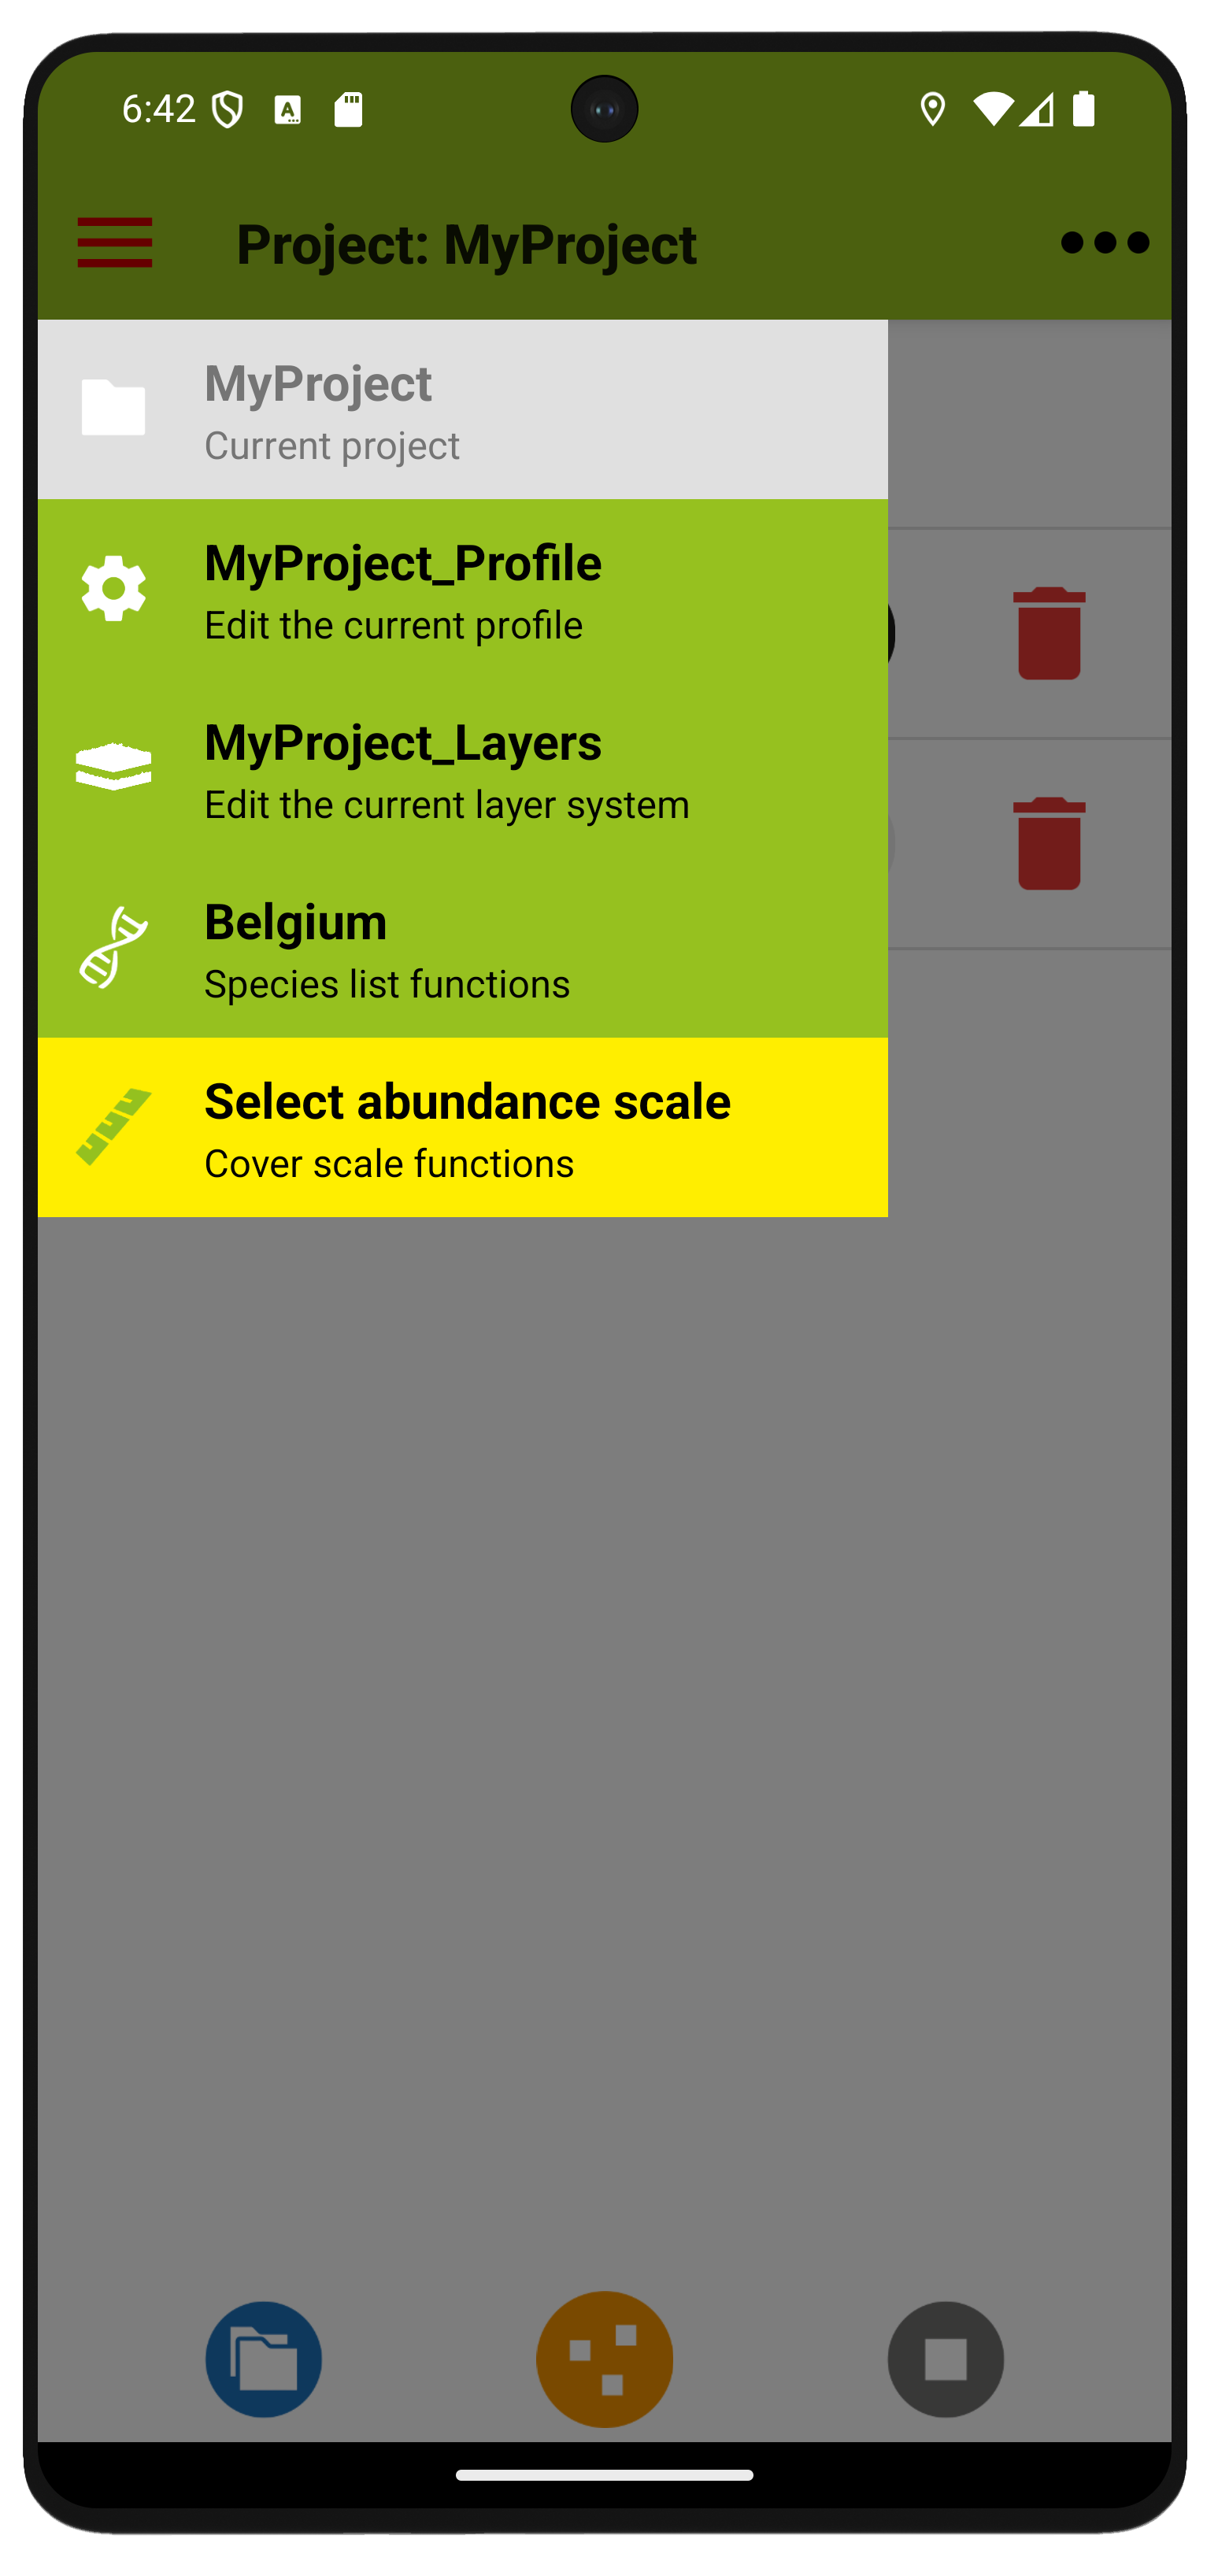
Two menus at the top provide access to functions: The left one contains frequently used functions and status information. If an entry is required, the menu symbol at the top turns red and the corresponding menu item turns yellow. A more comprehensive menu is located on the right.
Structure

The content in Vegapp is organised into projects. Profiles, which define the selection of input fields for a project, layer systems, which define how information about the vertical structure of plots is organised, species lists and cover scales are all linked to projects. A project consists of plot observations, i.e. sample sites with their location, species observations, individual plant observations, etc.
List of Projects

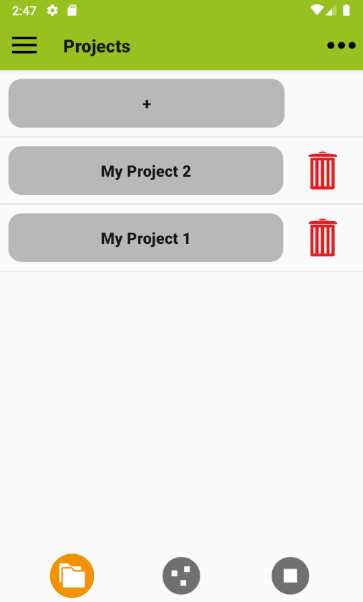
After starting the app you see a list of projects where you can add (plus button) or remove projects (bin icon). Use one of the grey buttons to navigate to its content or press and hold it to rename a project.
List of plot observations

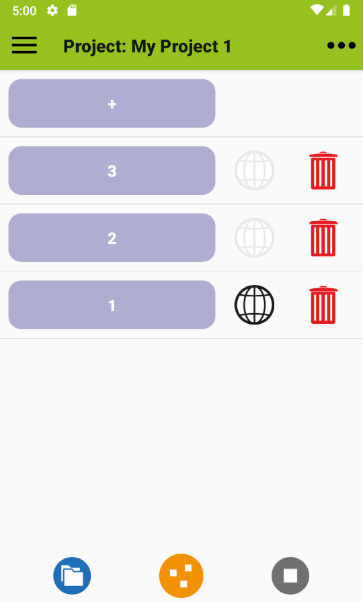
A project page contains a list of plot observations, where you can add and remove sample sites. Use the blue buttons to navigate to a plot observation. Tap on the globe icon to show the plot locations on a map, if possible. Use the left button in the navigation bar to return to the projects list.
Plot Observation

The plot observation page is where the actual data is entered. It is organized in four tabs. One is for meta information related to plots and plot observations, one for layers, one for individual plants, and one for plant species with their observed cover or abundance.
To turn back to the list of projects or plots you can use the blue buttons in the bottom navigation bar.
Customization


Profiles help you to tailor data entry to your activity. You can choose from a number of commonly used attributes, or define your own. You can also set default values to avoid entering the same information over and over again (like observer names). Layer systems and cover scales can be selected according to your needs, and localized species lists help speed up data entry. All this can be transferred between devices.
HOME UP
Privacy Policy, Contact, Impressum
